![]()
Symphonypy usage with your own reference
[ ]:
!pip install scanpy[leiden] openTSNE symphonypy
!gdown "1jW548g6ERFS0t7NywgyjRs6VaE5QwXbg&confirm=t"
[3]:
import numpy as np
import seaborn as sns
import scanpy as sc
import symphonypy as sp
import matplotlib.pyplot as plt

sc.set_figure_params(dpi=80)
sns.set_style("ticks")

adata_ref = sc.read_h5ad("PBMC_Satija.h5ad")
adata_ref.obs.head()
[3]:
| orig.ident | lane | donor | time | celltype.l1 | celltype.l2 | celltype.l3 | Phase | |
|---|---|---|---|---|---|---|---|---|
| L1_AAACCCACATCAGTCA | P3_3 | L1 | P3 | 3 | CD8 T | CD8 TEM | CD8 TEM_1 | G1 |
| L1_AAACCCATCCACACCT | P3_3 | L1 | P3 | 3 | CD8 T | CD8 Naive | CD8 Naive | S |
| L1_AAACCCATCTGCGGAC | P1_0 | L1 | P1 | 0 | CD4 T | CD4 TCM | CD4 TCM_1 | S |
| L1_AAACCCATCTTAAGGC | P2_3 | L1 | P2 | 3 | CD4 T | CD4 CTL | CD4 CTL | S |
| L1_AAACGAAAGATAACAC | P2_3 | L1 | P2 | 3 | B | B naive | B naive kappa | S |
Reference preprocessing and preparation for label transfer using Harmony. We recommend using the same normalization factor for reference and query datasets.
[4]:
sc.pp.normalize_total(adata_ref, target_sum=1e5)
sc.pp.log1p(adata_ref)
sc.pp.highly_variable_genes(
    adata_ref,
    batch_key="orig.ident",
    n_top_genes=3000,
)
adata_ref.raw = adata_ref
[5]:
adata_ref = adata_ref[:, adata_ref.var.highly_variable]
sc.pp.scale(adata_ref, max_value=10)
sc.pp.pca(adata_ref, n_comps=30, zero_center=False)
/usr/local/lib/python3.10/dist-packages/scanpy/preprocessing/_scale.py:299: UserWarning: Received a view of an AnnData. Making a copy.
  view_to_actual(adata)
The following step should be performed with harmony_integrate function from Symphonypy package (it appends additional information to AnnData object’s .uns slot).
[6]:
sp.pp.harmony_integrate(adata_ref, key="orig.ident", verbose=True, max_iter_harmony=20)
2024-04-09 16:33:03,320 - harmonypy - INFO - Computing initial centroids with sklearn.KMeans...
INFO:harmonypy:Computing initial centroids with sklearn.KMeans...
Harmony integration with harmonypy is preforming.
2024-04-09 16:33:09,883 - harmonypy - INFO - sklearn.KMeans initialization complete.
INFO:harmonypy:sklearn.KMeans initialization complete.
2024-04-09 16:33:10,051 - harmonypy - INFO - Iteration 1 of 20
INFO:harmonypy:Iteration 1 of 20
2024-04-09 16:33:17,282 - harmonypy - INFO - Iteration 2 of 20
INFO:harmonypy:Iteration 2 of 20
2024-04-09 16:33:25,645 - harmonypy - INFO - Iteration 3 of 20
INFO:harmonypy:Iteration 3 of 20
2024-04-09 16:33:33,824 - harmonypy - INFO - Iteration 4 of 20
INFO:harmonypy:Iteration 4 of 20
2024-04-09 16:33:41,147 - harmonypy - INFO - Iteration 5 of 20
INFO:harmonypy:Iteration 5 of 20
2024-04-09 16:33:49,117 - harmonypy - INFO - Iteration 6 of 20
INFO:harmonypy:Iteration 6 of 20
2024-04-09 16:33:52,868 - harmonypy - INFO - Iteration 7 of 20
INFO:harmonypy:Iteration 7 of 20
2024-04-09 16:34:00,917 - harmonypy - INFO - Converged after 7 iterations
INFO:harmonypy:Converged after 7 iterations
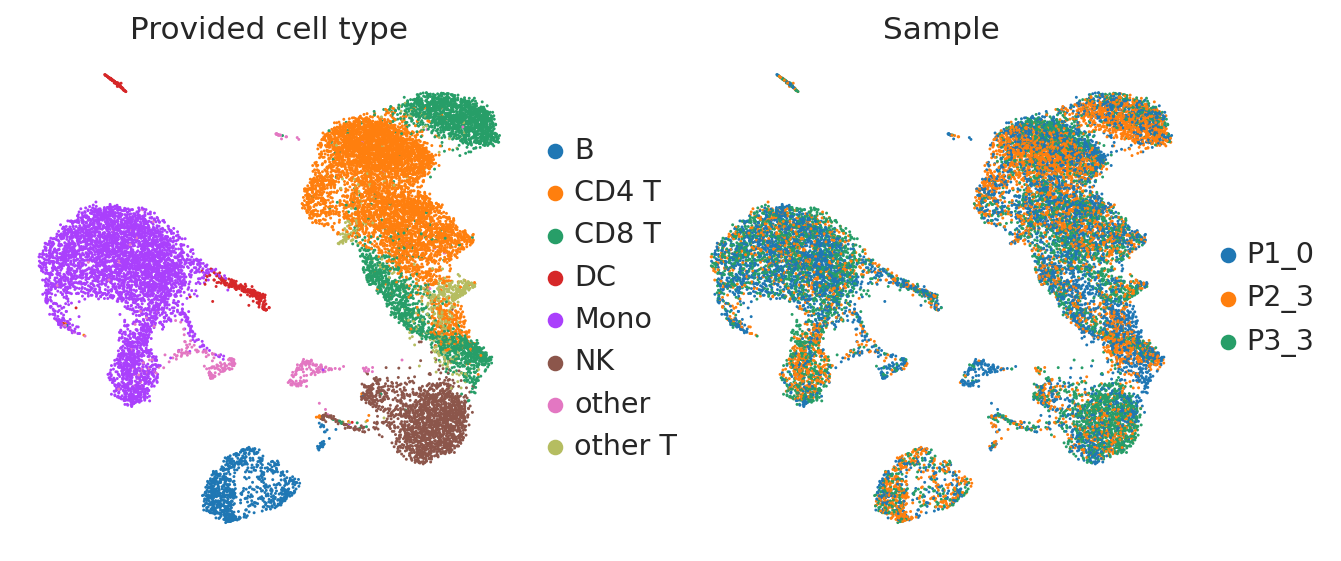
Now let’s compute UMAP for futher visualization and its coordinates transfer, and perform clustering with Leiden algorithm.
[7]:
sc.pp.neighbors(adata_ref, use_rep="X_pca_harmony")
sc.tl.umap(adata_ref)
<ipython-input-7-88438f323b91>:3: FutureWarning: In the future, the default backend for leiden will be igraph instead of leidenalg.

 To achieve the future defaults please pass: flavor="igraph" and n_iterations=2.  directed must also be False to work with igraph's implementation.
  sc.tl.leiden(adata_ref)
[8]:
sc.pl.umap(
    adata_ref,
    color=["celltype.l1", "orig.ident"],
    frameon=False,
    title=["Provided cell type", "Sample"],
)
Query mapping and label transfer
[9]:
adata_query = sc.datasets.pbmc3k()
sc.pp.normalize_total(adata_query, target_sum=1e5)
sc.pp.log1p(adata_query)
Let’s do embedding mapping and label transferring with symphonypy.
[10]:
# Mapping Harmony coordinates
sp.tl.map_embedding(adata_query=adata_query, adata_ref=adata_ref)

# Mapping UMAP coordinates
sp.tl.ingest(adata_query=adata_query, adata_ref=adata_ref)

# Labels prediction
sp.tl.transfer_labels_kNN(
    adata_query=adata_query,
    adata_ref=adata_ref,
    ref_labels=["celltype.l1"],
)
WARNING:symphonypy:504 out of 3000 genes from the reference are missing in the query dataset or have zero std in the reference, their expressions in the query will be set to zero
/usr/local/lib/python3.10/dist-packages/umap/umap_.py:1945: UserWarning: n_jobs value 1 overridden to 1 by setting random_state. Use no seed for parallelism.
  warn(f"n_jobs value {self.n_jobs} overridden to 1 by setting random_state. Use no seed for parallelism.")
/usr/local/lib/python3.10/dist-packages/sklearn/neighbors/_classification.py:215: DataConversionWarning: A column-vector y was passed when a 1d array was expected. Please change the shape of y to (n_samples,), for example using ravel().
  return self._fit(X, y)
Now we can calculate mapping score per cell and per cluster (see paper for more details).
[11]:
# Per cell mapping score
sp.tl.per_cell_confidence(
    adata_query=adata_query,
    adata_ref=adata_ref,
)
[12]:
# Per cluster mapping score
def cluster_data(adata, resolution=1):
  adata = adata.copy()
  sc.pp.scale(adata, max_value=10)
  sc.pp.pca(adata, n_comps=30)
  sc.pp.neighbors(adata)
  sc.tl.leiden(adata, resolution=resolution)
  return adata.obs["leiden"]

adata_query.obs["query_leiden"] = cluster_data(adata_query)

sp.tl.per_cluster_confidence(
    adata_query=adata_query,
    adata_ref=adata_ref,
    cluster_key="query_leiden",
)
[13]:
fig, axes = plt.subplots(figsize=(8, 4), ncols=2)

sc.pl.umap(
    adata_query,
    color="celltype.l1",
    frameon=False,
    title="Query dataset",
    ax=axes[0],
    show=False,
    legend_loc=None,
)

sc.pl.umap(
    adata_ref,
    color="celltype.l1",
    frameon=False,
    title="Reference dataset",
    ax=axes[1],
    show=False,
)
[13]:
<Axes: title={'center': 'Reference dataset'}, xlabel='UMAP1', ylabel='UMAP2'>

[14]:
marker_genes = {
    "B": ["MS4A1"],
    "other T": ["CD3E"],
    "CD4 T": ["IL7R"],
    "CD8 T": ["CD8A"],
    "NK": ["GNLY"],
    "Mono": ["MS4A7", "CD14"],
    "DC": ["FCER1A"],
    "other": ["CD34"],
}

adata_query.obs["celltype.l1"] = (
    adata_query.
    obs["celltype.l1"].
    cat.
    reorder_categories(
        list(marker_genes.keys())
    )
)

sc.pl.dotplot(
    adata_query,
    var_names=marker_genes,
    groupby="celltype.l1",
    standard_scale="var",
    dot_max=0.8,
    cmap="coolwarm",
)

t-SNE building and mapping with openTSNE
Here we use openTSNE t-SNE implementation that makes possible to add data points to existing t-SNE embedding.
[15]:
tSNE_model = sp.tl.tsne(adata_ref, use_rep="X_pca_harmony", return_model=True)
sp.tl.tsne(adata_query, use_rep="X_pca_harmony", use_model=tSNE_model)
[16]:
celltype_colors = dict(zip(
    adata_ref.obs["celltype.l1"].cat.categories,
    adata_ref.uns["celltype.l1_colors"],
))
adata_query.uns["celltype.l1_colors"] = [
    celltype_colors[ct] for ct in adata_query.obs["celltype.l1"].cat.categories
]
[17]:
fig, axes = plt.subplots(figsize=(8, 4), ncols=2)

sc.pl.tsne(
    adata_ref,
    color="celltype.l1",
    frameon=False,
    title="Reference dataset",
    ax=axes[1],
    show=False,
)

sc.pl.tsne(
    adata_query,
    color="celltype.l1",
    frameon=False,
    title="Query dataset",
    ax=axes[0],
    show=False,
    legend_loc=None,
)
[17]:
<Axes: title={'center': 'Query dataset'}, xlabel='tSNE1', ylabel='tSNE2'>

You can save the model with pickle or using the argument save_path of sp.tl.tsne().
[18]:
import pickle

with open("PBMC_tSNE_model.pickle", "wb") as model_file:
    pickle.dump(tSNE_model, model_file, protocol=pickle.HIGHEST_PROTOCOL)
Mapping confidence metrics
[19]:
sc.pl.umap(
    adata_query,
    color=["symphony_per_cell_dist", "celltype.l1"],
    frameon=False,
    title=["Mapping score\n(less is better)", "Transferred cell type"],
    vmax=20,
    cmap="RdBu_r",
)

[20]:
import seaborn as sns
sns.set_style("ticks")

boxplot_colordict = {
    "boxprops": {"edgecolor": "black"},
    "medianprops": {"color": "black"},
    "whiskerprops": {"color": "black"},
    "capprops": {"color": "black"},
}

fig, axes = plt.subplots(figsize=(8, 4), ncols=2)

sns.boxplot(
    x="query_leiden",
    y="symphony_per_cell_dist",
    data=adata_query.obs,
    showfliers=False,
    color="lightgrey",
    linewidth=1,
    ax=axes[0],
    **boxplot_colordict,
)
axes[0].set_xlabel("Query clusters")
axes[0].set_ylabel("Mapping score\n(less is better)")
axes[0].set_title("Per cell mapping score")
axes[0].grid(alpha=0.3)

adata_query.uns["symphony_per_cluster_dist"]["dist"].plot.bar(
    width=1,
    edgecolor="black",
    color="lightgrey",
    ax=axes[1],
)
axes[1].set_xlabel("Query cluster")
axes[1].set_title("Per cluster mapping score")
axes[1].grid(alpha=0.3)
axes[1].tick_params(axis="x", labelrotation=0)

ylim = max(axes[0].get_ylim()[1], axes[1].get_ylim()[1])
axes[0].set_ylim(0, ylim)
axes[1].set_ylim(0, ylim)
[20]:
(0.0, 12.289875026902362)
