![]()
Symphonypy usage with pre-computed references
[ ]:
!pip install scanpy[leiden] symphonypy
[4]:
import matplotlib.pyplot as plt
import seaborn as sns

import scanpy as sc
import symphonypy as sp

sc.set_figure_params(dpi=80)
sns.set_style("ticks")
List of available datasets is here.
[5]:
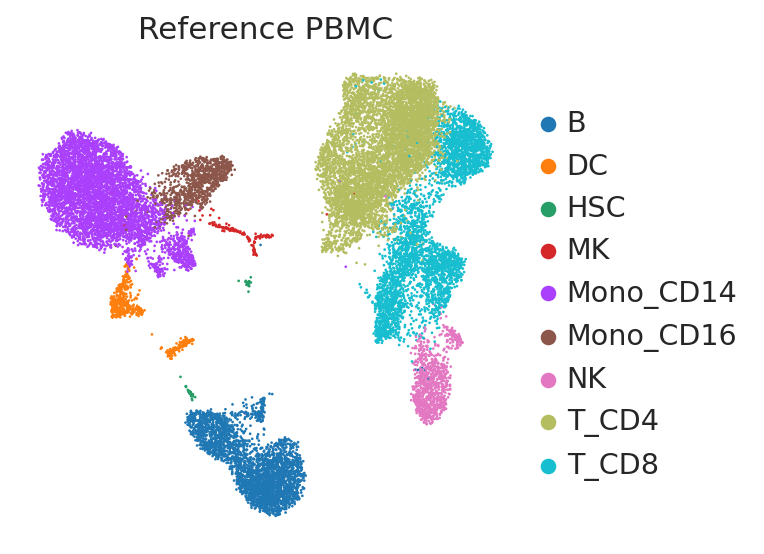
adata_ref = sp.datasets.pbmcs_10x_reference()
sc.pl.umap(
    adata_ref,
    color="cell_type",
    frameon=False,
    title="Reference PBMC",
)
Before Symphony label transfer query dataset should be log1p-normalized.
[6]:
adata_query = sc.datasets.pbmc3k()

# Query preprocessing
sc.pp.normalize_total(adata_query, target_sum=1e4)
# target_sum=1e4 is prefered if you use pre-built references
sc.pp.log1p(adata_query)
[7]:
# Mapping Harmony coordinates
sp.tl.map_embedding(adata_query=adata_query, adata_ref=adata_ref)

# Mapping UMAP coordinates
sp.tl.ingest(adata_query=adata_query, adata_ref=adata_ref)

# Labels prediction
sp.tl.transfer_labels_kNN(
    adata_query=adata_query,
    adata_ref=adata_ref,
    ref_labels="cell_type",
)
WARNING:symphonypy:446 out of 2357 genes from the reference are missing in the query dataset or have zero std in the reference, their expressions in the query will be set to zero
/usr/local/lib/python3.10/dist-packages/umap/umap_.py:1945: UserWarning: n_jobs value 1 overridden to 1 by setting random_state. Use no seed for parallelism.
  warn(f"n_jobs value {self.n_jobs} overridden to 1 by setting random_state. Use no seed for parallelism.")
[8]:
# Per cell mapping score — optional
sp.tl.per_cell_confidence(
    adata_query=adata_query,
    adata_ref=adata_ref,
)
[9]:
# Per cluster mapping score — optional
def cluster_data(adata, resolution=1):
  adata = adata.copy()
  sc.pp.scale(adata, max_value=10)
  sc.pp.pca(adata, n_comps=30)
  sc.pp.neighbors(adata)
  sc.tl.leiden(adata, resolution=resolution)
  return adata.obs["leiden"]

adata_query.obs["query_leiden"] = cluster_data(adata_query)

sp.tl.per_cluster_confidence(
    adata_query=adata_query,
    adata_ref=adata_ref,
    cluster_key="query_leiden",
)
<ipython-input-9-c8757db831cc>:7: FutureWarning: In the future, the default backend for leiden will be igraph instead of leidenalg.

 To achieve the future defaults please pass: flavor="igraph" and n_iterations=2.  directed must also be False to work with igraph's implementation.
  sc.tl.leiden(adata, resolution=resolution)
Results visualization.
[10]:
# Matching cell type colors
adata_query.obs["cell_type"] = adata_query.obs["cell_type"].astype("category")
adata_query.uns["cell_type_colors"] = [dict(zip(
    adata_ref.obs["cell_type"].cat.categories,
    adata_ref.uns["cell_type_colors"],
))[ct] for ct in adata_query.obs["cell_type"].cat.categories]
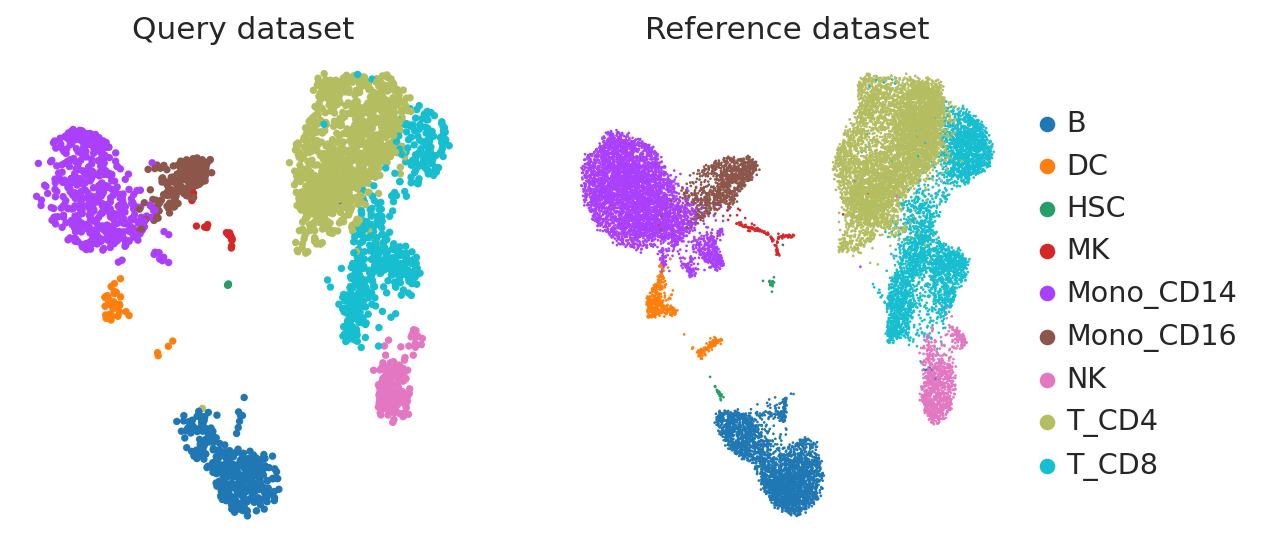
[11]:
fig, axes = plt.subplots(figsize=(8, 4), ncols=2)

sc.pl.umap(
    adata_query,
    color="cell_type",
    frameon=False,
    title="Query dataset",
    ax=axes[0],
    show=False,
    legend_loc=None,
)

sc.pl.umap(
    adata_ref,
    color="cell_type",
    frameon=False,
    title="Reference dataset",
    ax=axes[1],
    show=False,
)
[11]:
<Axes: title={'center': 'Reference dataset'}, xlabel='UMAP1', ylabel='UMAP2'>
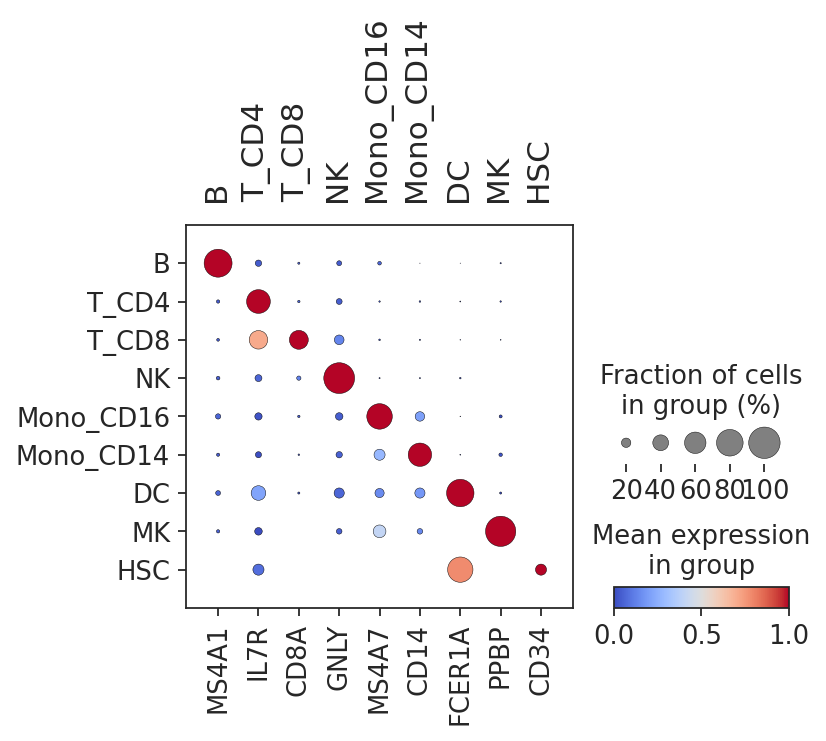
[12]:
marker_genes = {
    "B": ["MS4A1"],
    "T_CD4": ["IL7R"],
    "T_CD8": ["CD8A"],
    "NK": ["GNLY"],
    "Mono_CD16": ["MS4A7"],
    "Mono_CD14": ["CD14"],
    "DC": ["FCER1A"],
    "MK": ["PPBP"],
    "HSC": ["CD34"],
}

adata_query.obs["cell_type"] = (
    adata_query.
    obs["cell_type"].
    cat.
    reorder_categories(
        list(marker_genes.keys())
    )
)

sc.pl.dotplot(
    adata_query,
    var_names=marker_genes,
    groupby="cell_type",
    standard_scale="var",
    dot_max=1,
    cmap="coolwarm",
)
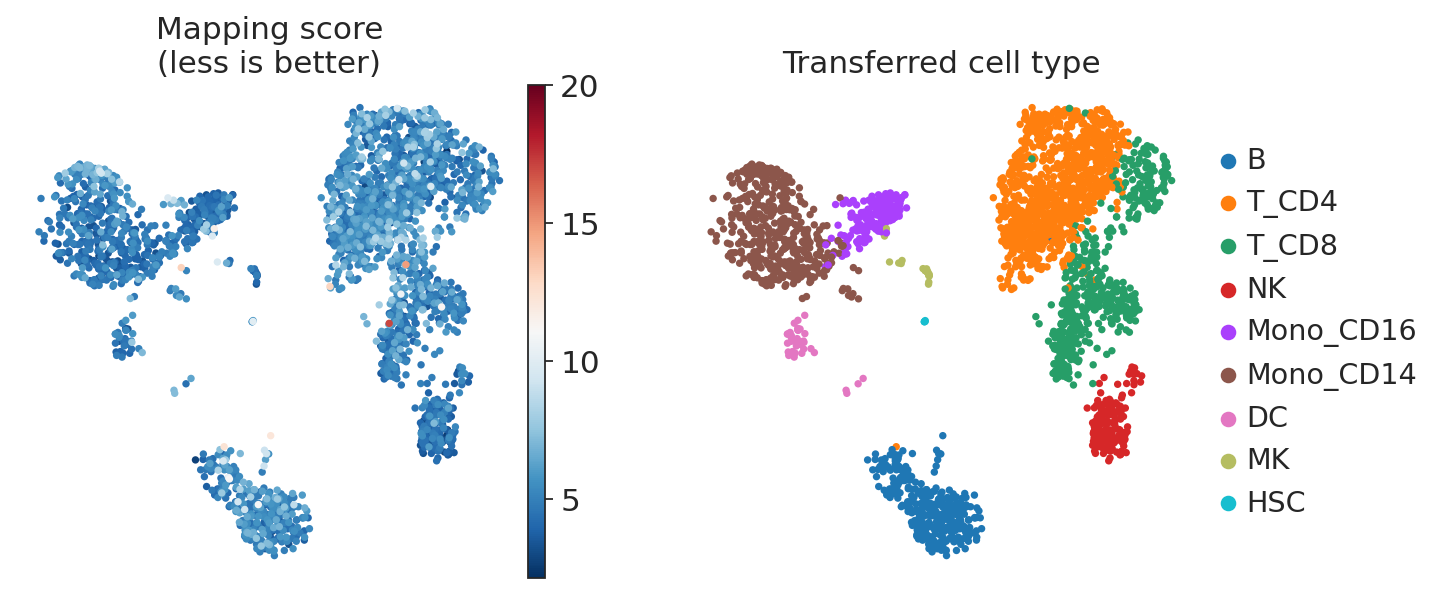
[14]:
sc.pl.umap(
    adata_query,
    color=["symphony_per_cell_dist", "cell_type"],
    frameon=False,
    title=["Mapping score\n(less is better)", "Transferred cell type"],
    vmax=20,
    cmap="RdBu_r",
)
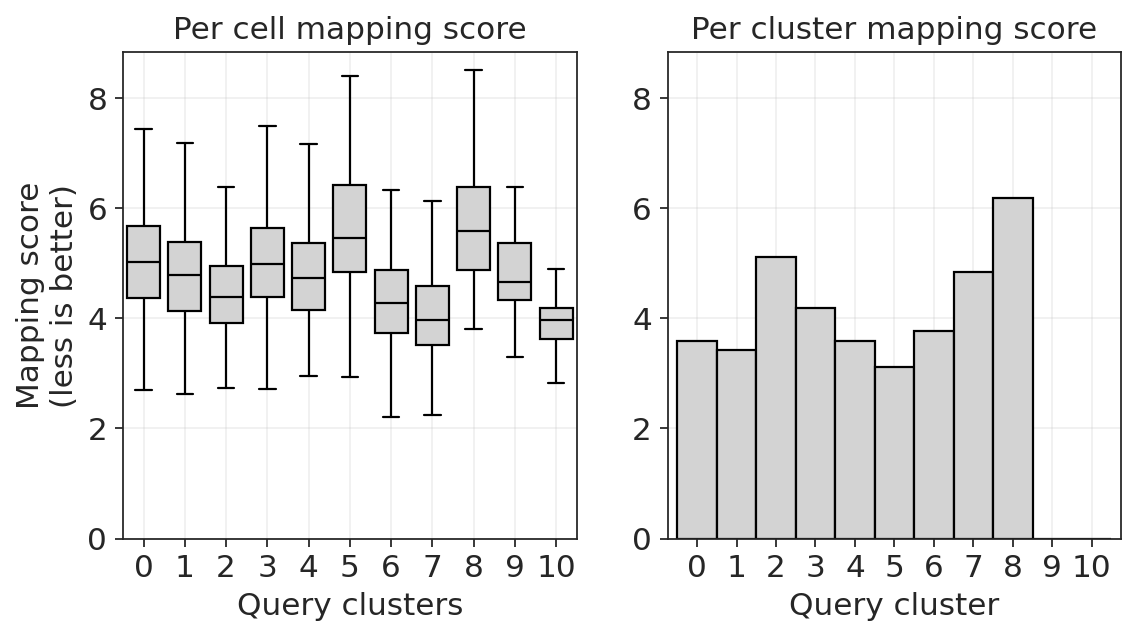
[15]:
boxplot_colordict = {
    "boxprops": {"edgecolor": "black"},
    "medianprops": {"color": "black"},
    "whiskerprops": {"color": "black"},
    "capprops": {"color": "black"},
}

fig, axes = plt.subplots(figsize=(8, 4), ncols=2)

sns.boxplot(
    x="query_leiden",
    y="symphony_per_cell_dist",
    data=adata_query.obs,
    showfliers=False,
    color="lightgrey",
    linewidth=1,
    ax=axes[0],
    **boxplot_colordict,
)
axes[0].set_xlabel("Query clusters")
axes[0].set_ylabel("Mapping score\n(less is better)")
axes[0].set_title("Per cell mapping score")
axes[0].grid(alpha=0.3)

adata_query.uns["symphony_per_cluster_dist"]["dist"].plot.bar(
    width=1,
    edgecolor="black",
    color="lightgrey",
    ax=axes[1],
)
axes[1].set_xlabel("Query cluster")
axes[1].set_title("Per cluster mapping score")
axes[1].grid(alpha=0.3)
axes[1].tick_params(axis="x", labelrotation=0)

ylim = max(axes[0].get_ylim()[1], axes[1].get_ylim()[1])
axes[0].set_ylim(0, ylim)
axes[1].set_ylim(0, ylim)
[15]:
(0.0, 8.83061728686151)